Figures
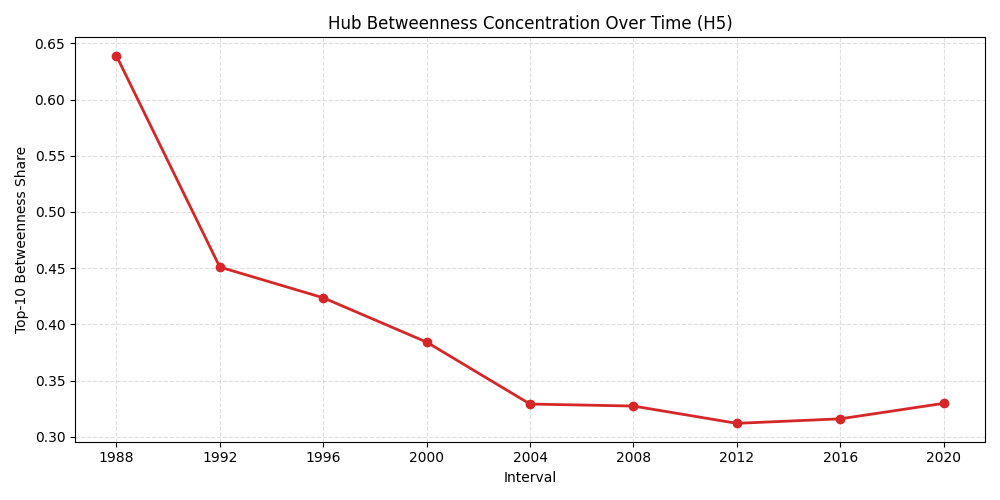
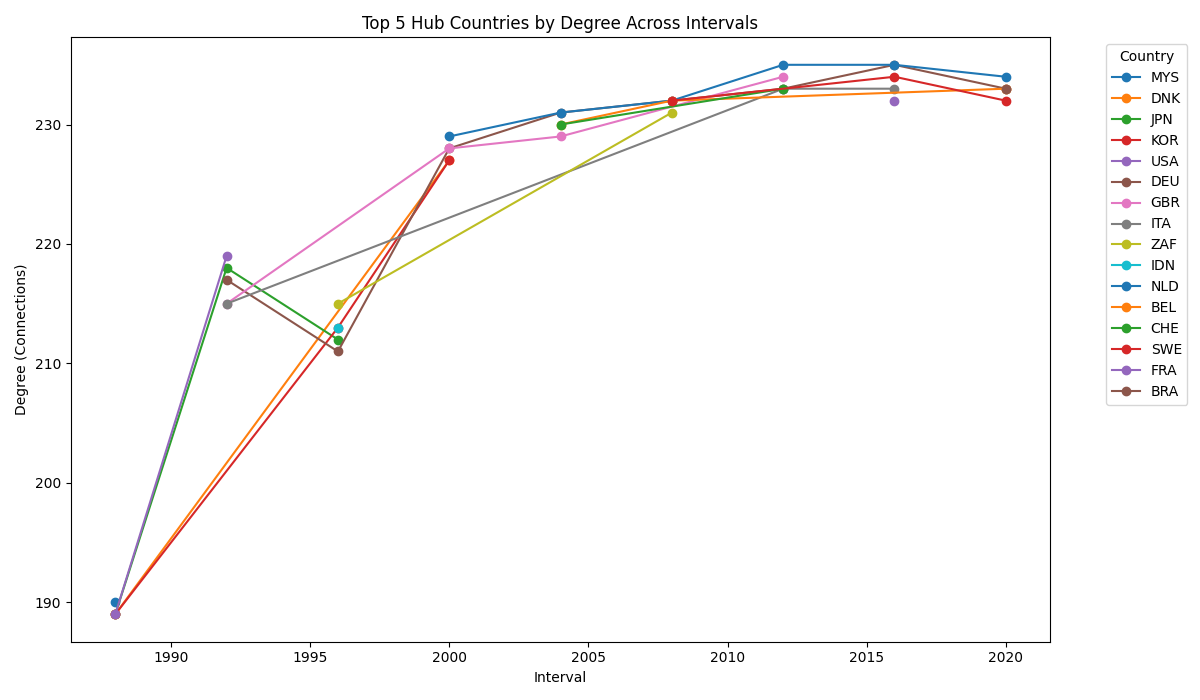
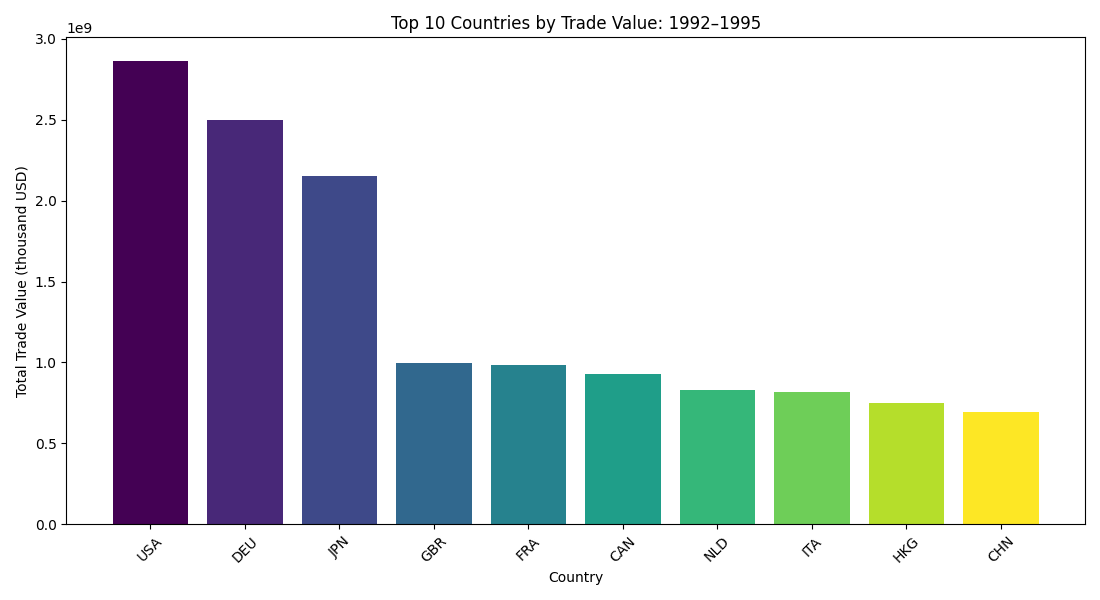
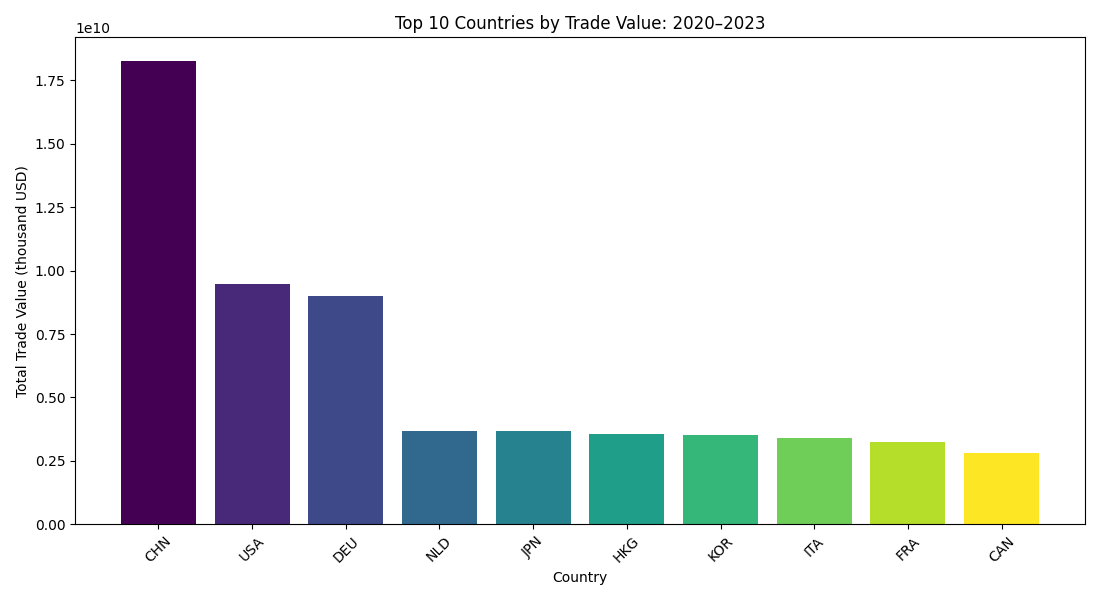
Selected results from the thesis: the shrinking, densifying world, growing hub concentration, and the rise of new hubs.
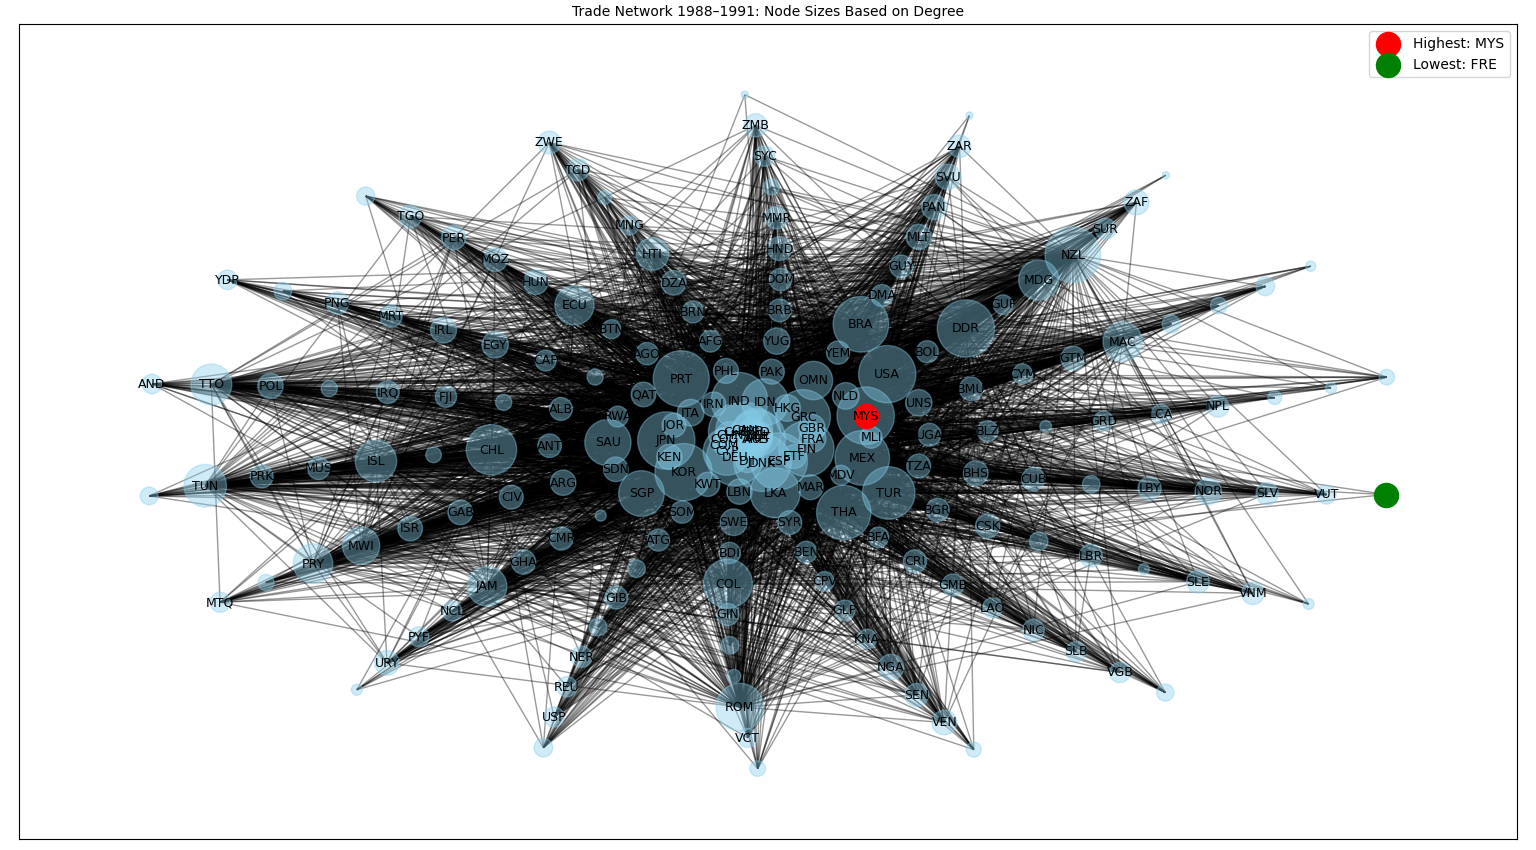
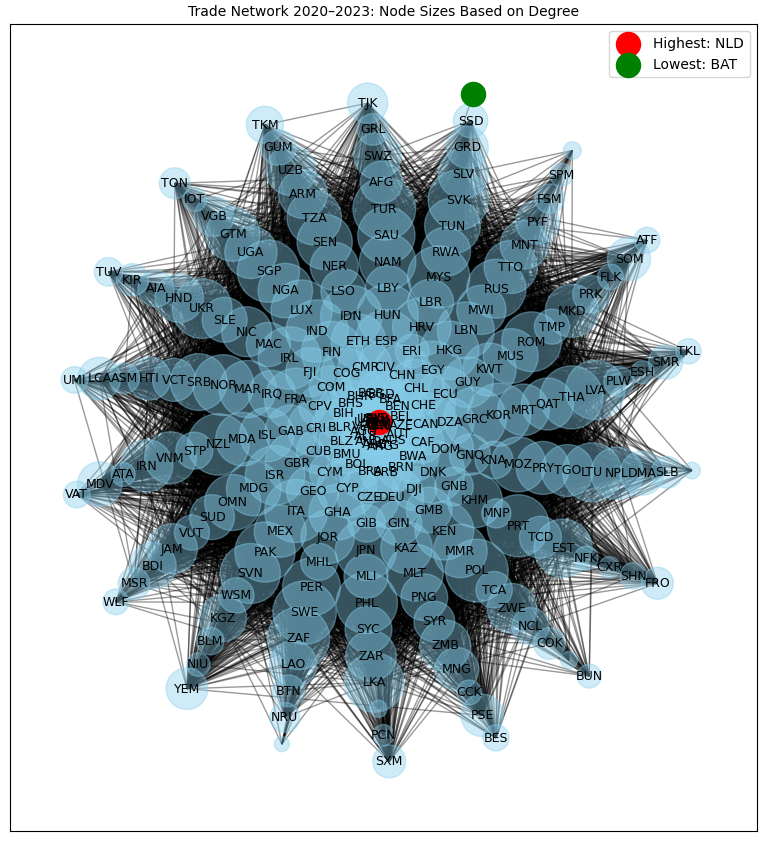
The network, then and now
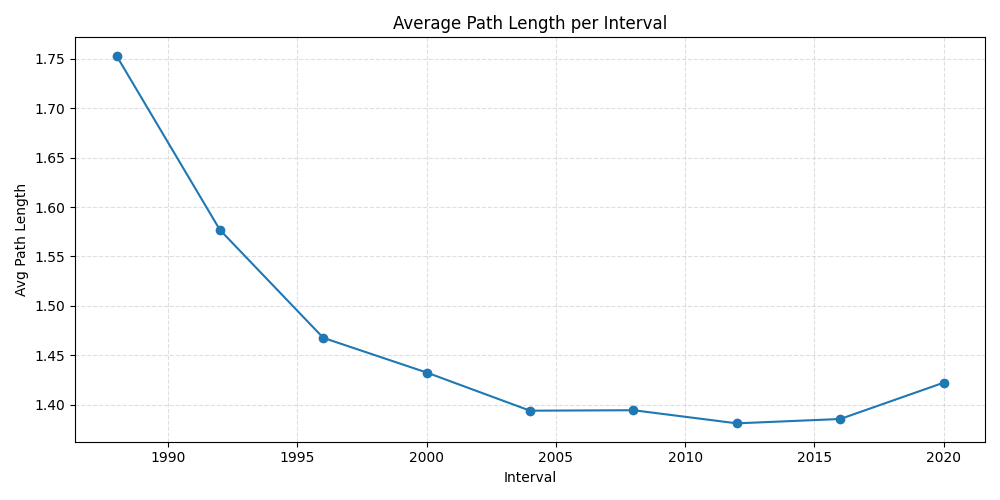
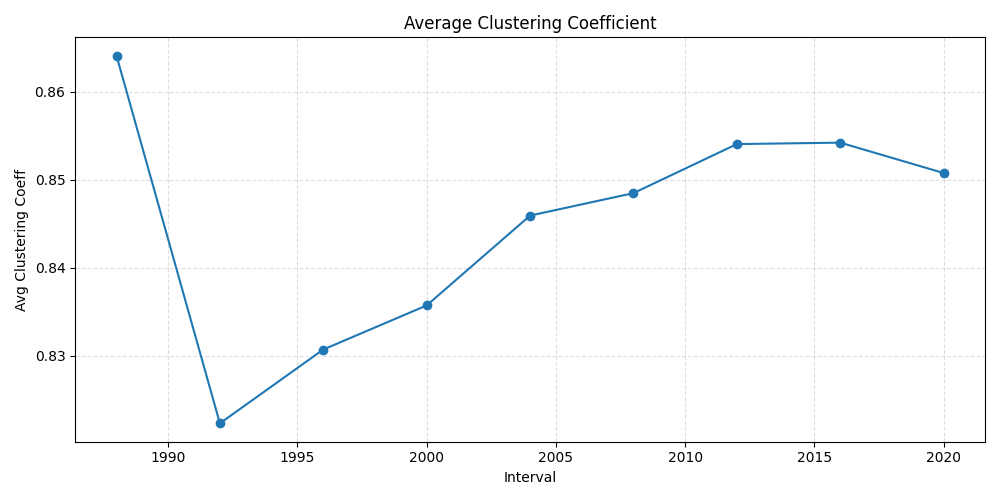
The small-world signature over time
The rise of China
M.S. Thesis · Data Science · UMass Dartmouth
A geospatial small-world analysis of 35 years of international trade, 1988-2022
I modeled global supply chains as geospatially embedded small-world networks across 188 reporting economies and nine four-year intervals - showing that world trade is efficient and tightly clustered, robust to random shocks, yet fragile to the targeted loss of hub economies.
M.S. Data Science, August 2026 · Advisor: Prof. Firas Khatib · Committee: Dr. Ashokkumar Patel, Dr. Debarun Das
Do the structural laws that govern social and biological networks also govern the world economy? This thesis answers empirically, building nine snapshots of the global trade network - one per four-year interval from 1988 to 2022 - and testing whether each exhibits the small-world signature: short average path lengths alongside high local clustering.
The work integrates network science with geospatial analysis (the study's SCNE framework), treating each economy as a node embedded at its real-world coordinates and each bilateral trade relationship as a weighted edge. Across all nine intervals the network is unambiguously small-world; its hub structure grows more concentrated over time; and, most consequentially for supply-chain risk, it proves highly resilient to random disruption but acutely vulnerable to the targeted removal of its most connected economies.
Turning raw UN Comtrade dumps into nine analysis-ready networks was a substantial data-engineering task in its own right.
The raw source was 35 annual UN Comtrade HS product-level export files (1988-2022). A reproducible pandas pipeline batch-ingests and consolidates them into roughly 25 million product-level records, joins every country to its coordinates, harmonizes ISO3 codes (e.g., merging Belgium-Luxembourg into BEL), and strips self-loops and regional aggregates (EU, World, "areas nes"). Cleaning yields a geo-referenced working set (~2.5 GB), aggregated to 613,252 bilateral export observations at the country-pair-year level and assembled into nine interval networks in NetworkX.
Reporting economies and their trade partners are nodes; bilateral trade relationships above a USD 1M threshold are weighted, undirected edges. A handful of hub economies carry a disproportionate share of connections, giving the network short average path lengths (any two countries sit a few steps apart) alongside high local clustering - the small-world signature, and the same hub structure that makes it efficient yet vulnerable to targeted disruption.
Nine formal hypotheses tested: six confirmed, two partially confirmed (H2 scale-free, H9 resilience-metric convergence), one pending (H8 SIRS risk transmission).
Every interval is unambiguously small-world (σ > 1.2), with consistently high clustering (C in the 0.82-0.86 range). As trade deepened, the world got "smaller": average path length fell from 1.75 to 1.38, with diameter 3 and radius 2 throughout.
The degree distribution follows a power law, but the exponent evolved from α = 2.38 (1988) to α = 2.60 (2020) - drifting outside the tight [2.0-2.4] band the hypothesis predicted, so H2 is recorded as partially confirmed rather than a clean fit. This is a real result, reported as partial rather than rounded up.
Despite globalization, geography remains a strong organizing force: geographic proximity and bilateral clustering correlate at r = 0.72 (H6), and Louvain community detection recovers three geographically coherent blocs - Asia-Pacific, European, and North American. Cross-regional corridors carry global connectivity.
The network absorbs 60-75% random node removal before fragmenting - but removing just 15-20% of its hub economies collapses the largest connected component from 98% to 22% (H7). A severity-0.8 cascade shock to China produces ~80% immediate trade loss with a 40-step recovery under rerouting. That asymmetry is precisely the supply-chain resilience question: it identifies which economies, if disrupted, would break global trade.
Selected results from the thesis: the shrinking, densifying world, growing hub concentration, and the rise of new hubs.
The hub-fragility result is a supply-chain resilience question in disguise: it pinpoints the economies whose disruption would fragment global trade - the same analysis risk and logistics teams run on their own networks.
A reproducible pipeline distilling ~25M raw records into 613K bilateral observations and nine analysis-ready networks - the kind of end-to-end data work that underpins any real analytics system.
The same small-world tools that describe trade apply to communication, logistics, and multi-agent systems - a through-line into my work on efficient agent coordination.