Data Science, Analytics & BI · LLM & Agent Systems · Network Science
I turn complex data into decisions - dashboards, forecasts, and models people can act on - and build multi-agent LLM systems that coordinate efficiently. My work is measured, ablated, and honest about its limits. M.S. in Data Science. Based in Massachusetts - open to relocation across the U.S.
Hub removal that fragments ~80% of the trade network
28,000+
Seismic records analyzed
Every figure comes from a measured experiment or from my thesis and preprint - not estimates.
About
I turn data into decisions and study systems that coordinate - whether that's a business reporting on its operations, a set of autonomous agents sharing one task, or 188 economies trading across 35 years. Across all of them, the structure of how things connect explains more than the properties of the things themselves.
On the applied side, I've built BI dashboards and reporting, SQL and ETL pipelines across multiple source systems, and forecasting and segmentation models. On the research side, I designed and built SW-KG, a multi-agent LLM coordination architecture that shares context through a consolidated knowledge graph to cut communication overhead between agents, and my master's thesis modeled UN Comtrade bilateral trade as a geospatially embedded small-world network that is robust to random disruption but fragile to targeted removal of hub economies. I've also shipped retrieval-augmented generation (RAG) pipelines over enterprise data.
I care about knowing exactly what a result does and doesn't show - most of what I've learned came from the experiments that didn't work. I'm looking for data-science, analytics, BI, and AI-engineering roles across business intelligence, generative AI, agentic systems, and network / supply-chain intelligence.
Work authorization: F-1 with OPT + 24-month STEM OPT - up to 3 years of U.S. work authorization, no employer sponsorship required during that period (the STEM extension requires an E-Verify employer).
Analytics, BI & forecasting
Agentic AI & multi-agent LLM systems
Rigorous, honest evaluation
Roles I fit
Data AnalystData ScientistBI / Analytics DeveloperMachine Learning EngineerLLM / AI Systems EngineerAI Agent EngineerApplied Scientist (AI/ML)
Why this work matters
The through-line across my work is turning connected data into decisions - and each result maps to a live business problem.
Analytics & BI
From raw data to decisions
Most of the value in analytics is the last step: turning a messy, multi-source dataset into a dashboard or forecast a business leader can act on. My BI and forecasting work is built around that step - clear KPIs, reproducible pipelines, and reporting people actually use.
Supply-chain & risk
Which nodes break the network
The thesis's hub-fragility result is a supply-chain resilience question in disguise: identify which economies, if disrupted, fragment global trade. That's the same analysis logistics, procurement, and risk teams run on their own networks.
Trustworthy ML
What separates a demo from a system
Across every project I quantify what works and report what doesn't - controlled ablations, break-even points, and data-provenance catches. That evaluation discipline is what makes a model deployable rather than just demo-able.
Technical skills
BI, Analytics & Reporting
Power BITableauDashboards & ScorecardsAutomated ReportingKPI AnalysisSelf-Service DatasetsStakeholder Reporting
Research and engineering work, each with measured outcomes and stated methodology.
SW-KG - Multi-Agent LLM Coordination
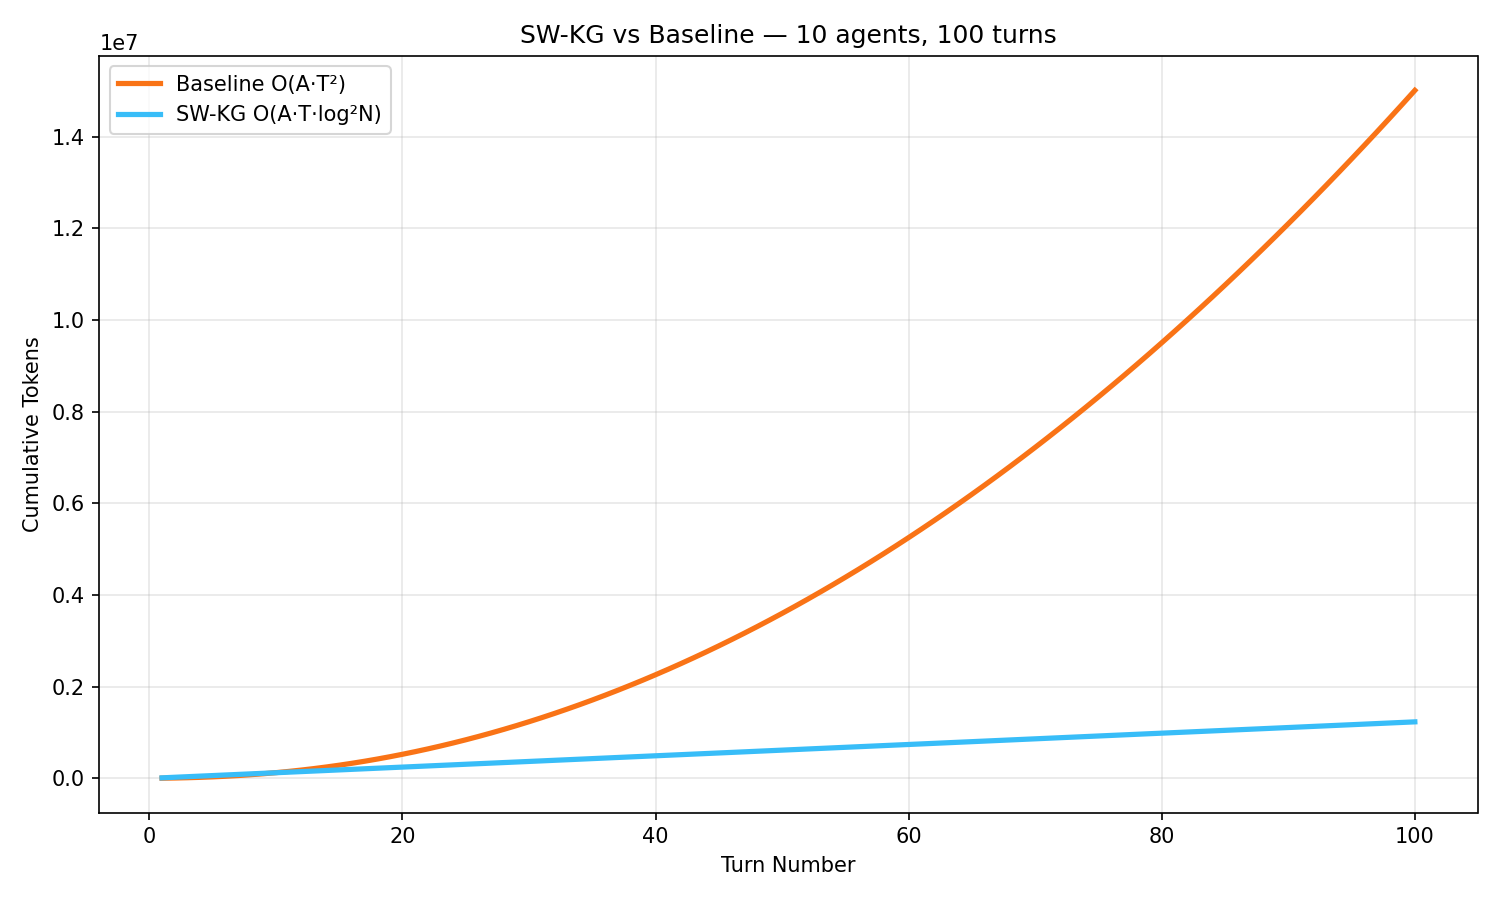
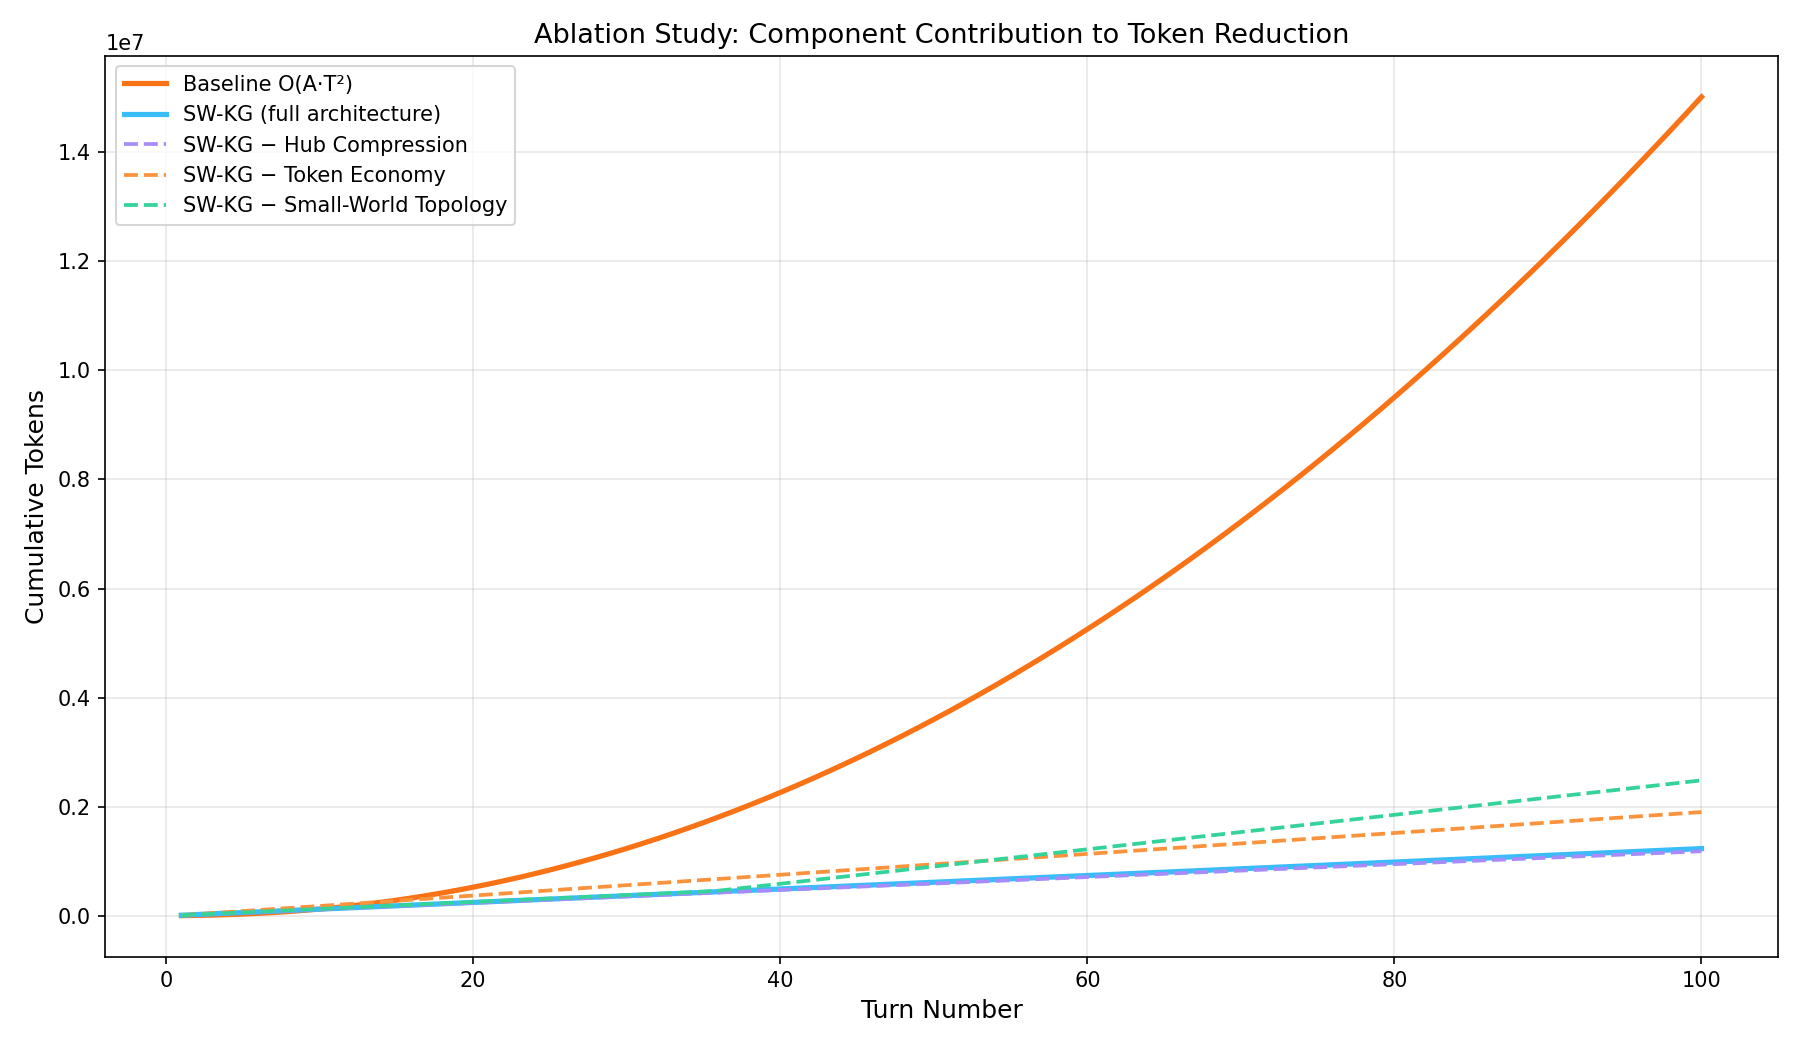
A coordination architecture that arranges agents over a small-world topology and shares context through a consolidated knowledge graph instead of re-broadcasting full history. 91.8% fewer inter-agent tokens (a 12.19x reduction) at 10-agent, 100-turn scale, measured on the Claude API and isolated by controlled ablations. Published as a preprint.
Master's thesis modeling 35 years of UN Comtrade trade (1988-2022) across 188 reporting economies as nine interval small-world networks - distilled by a from-scratch pipeline that processes ~25M product-level export records into a compact, analysis-ready dataset. Findings include collapse under just 15-20% targeted hub removal (vs. tolerating 60-75% random removal) and strong geography-clustering correlation (r = 0.72).
A global study over 28,000+ USGS seismic records (1960-2023): K-Means and DBSCAN clustering aligned to major tectonic boundaries, an interactive global density map, and time-series and risk-classification modeling. The analysis also surfaced and documented a data-provenance issue - former nuclear-test sites appearing as high-probability "seismic" locations in the source catalog - rather than smoothing it over.
Designed a fully normalized relational schema (students, departments, courses, enrollments) with ER diagrams, integrity constraints, and complex SQL - views and stored procedures for realistic reporting.
Collected real process metrics (top, ps, pidstat) on Ubuntu and compared the Linux CFS scheduler's live behavior against textbook algorithms with Python analytics and visualizations.
Two preprinted / published works and a completed master's thesis - each with its methodology, metrics, and a plain-language explanation of how the system works.
SW-KG: Small-World Topology for Multi-Agent LLM Coordination
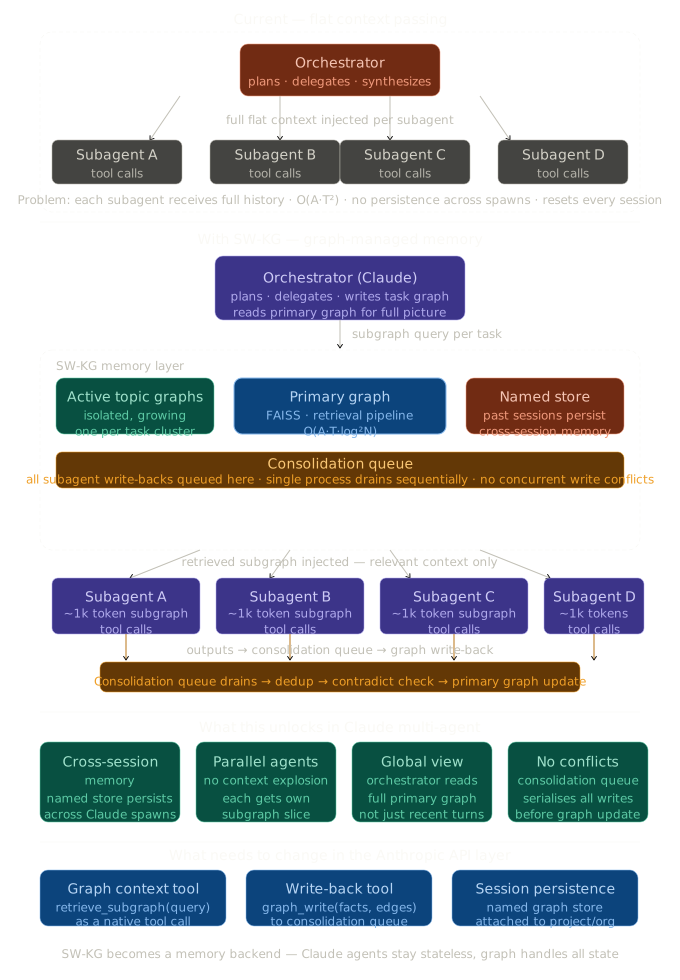
Multi-agent LLM systems spend most of their tokens re-sharing context with each other. SW-KG addresses this structurally: agents communicate over a small-world topology and read task-relevant subgraphs from a consolidated, FAISS-indexed knowledge graph of vector embeddings, rather than re-broadcasting full history. A token economy meters inference cost and a hub-promotion mechanism elevates frequently-routed nodes.
Each agent pulls only a small, task-relevant slice of shared memory instead of the whole conversation. Results are written back through a single queue, so concurrent writes never conflict, and the primary graph stays consistent as it grows - the mechanism behind the 91.8% token reduction (12.19x fewer tokens), cutting LLM inference cost.
Architecture - shared graph memory replaces full-context passing.Measured token cost - 10 agents × 100 turns on the Claude API.Ablation - each component isolated; net-negative results reported, not hidden.
Key Results
91.8% inter-agent token reduction versus a full-history baseline (10-agent, 100-turn task, measured on the Claude API)
The same result expressed as a ratio: 12.19x fewer tokens at that scale
Each architectural component isolated through controlled ablation studies
Limitations & Current Work
Break-even is near turn 10 - SW-KG wins on long-horizon tasks, not short ones
Hub compression was net-negative on token metrics in isolation and is reported as such
Empirical scaling is near-linear - weaker than the theoretical bound the design targets
A v2 pairing HNSW retrieval with the coordination layer is in progress
Small-World Spatial Network Analysis of Global Supply Chains Using International Trade Data (1988-2022)
M.S. Thesis · University of Massachusetts Dartmouth (2026) · DOI 10.62791/20625
Modeled global supply chains as geospatially embedded small-world networks across 188 reporting economies and nine four-year intervals, integrating network science with spatial analysis. Findings: pronounced small-world structure, strong regional clustering, and asymmetric resilience under targeted disruption.
The raw source was 35 annual UN Comtrade HS product-level export files (1988-2022). I built a reproducible pandas pipeline to batch-ingest and consolidate them into roughly 25 million product-level trade records, join every country to its coordinates, harmonize ISO3 codes (e.g., merging Belgium-Luxembourg into BEL), and strip self-loops and regional aggregates (EU, World, "areas nes"). Cleaning produced a geo-referenced working set (~2.5 GB), which I then aggregated down to country-pair-year totals - a compact analysis-ready table that feeds the nine interval networks built in NetworkX.
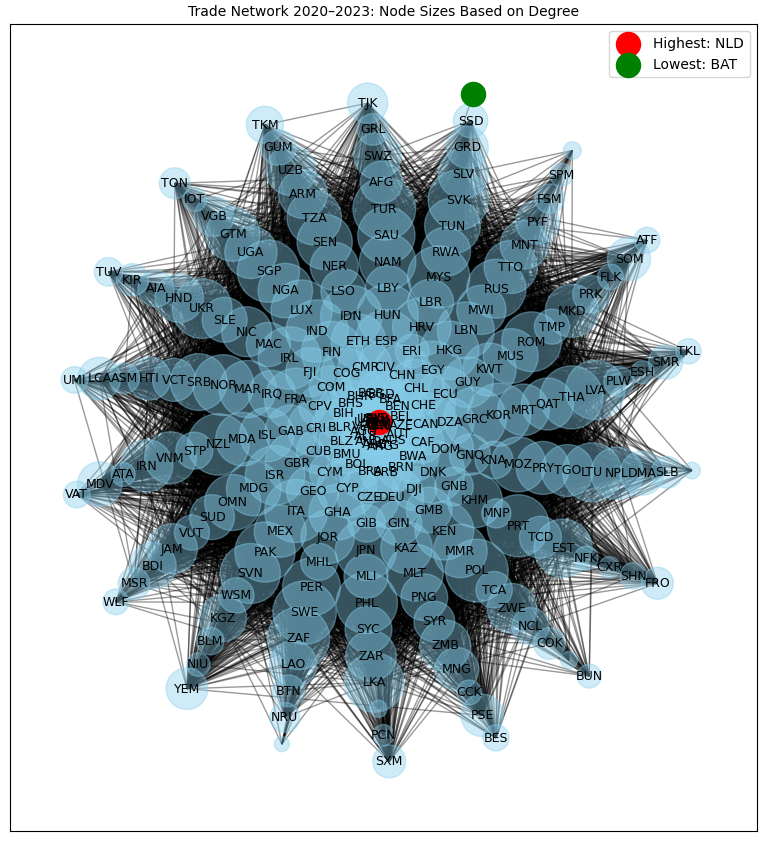
How to read the network - structure
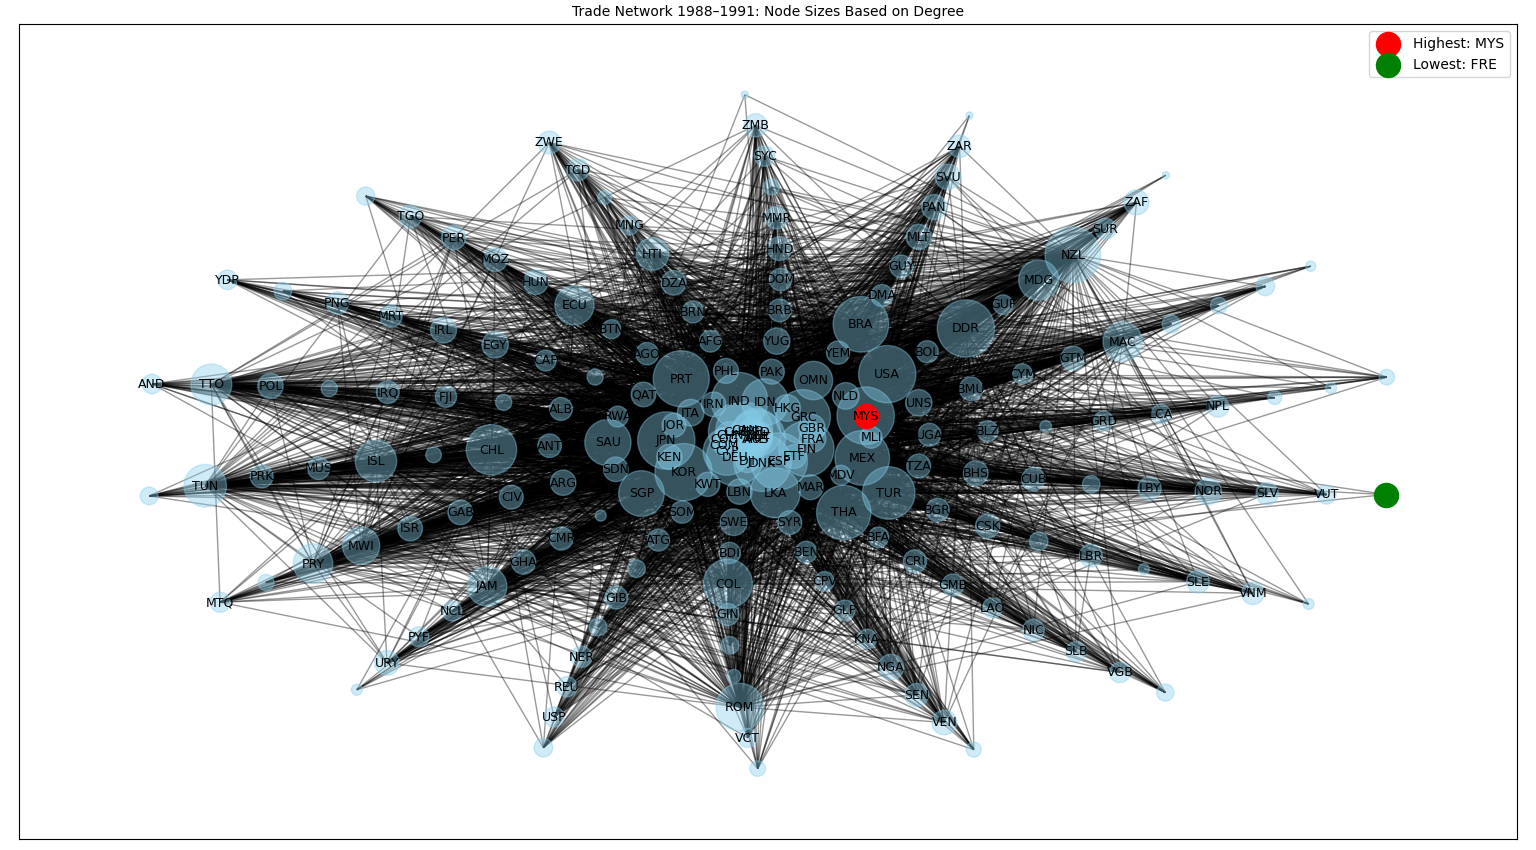
188 reporting economies (+ partner-only nodes) = up to 238 nodes→Trade flows = weighted edges→Hub economies = high degree→Small-world: high clustering + short paths
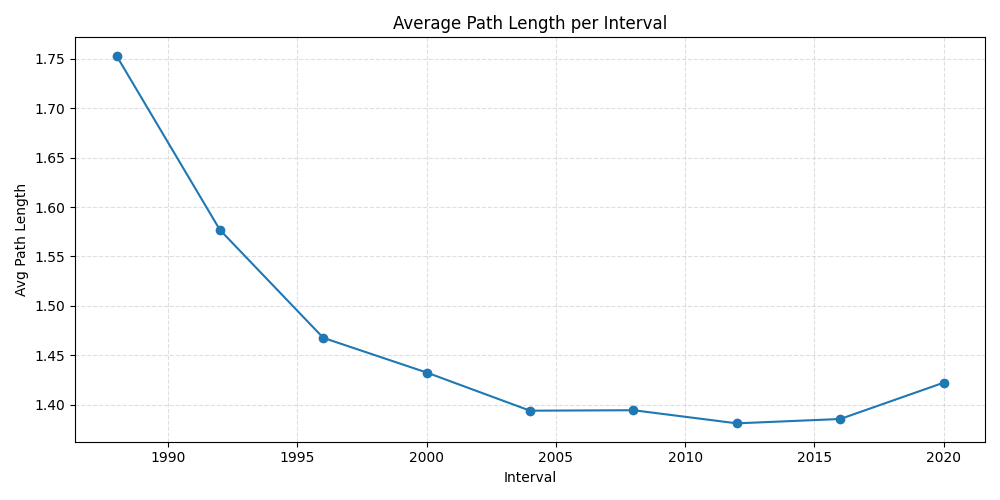
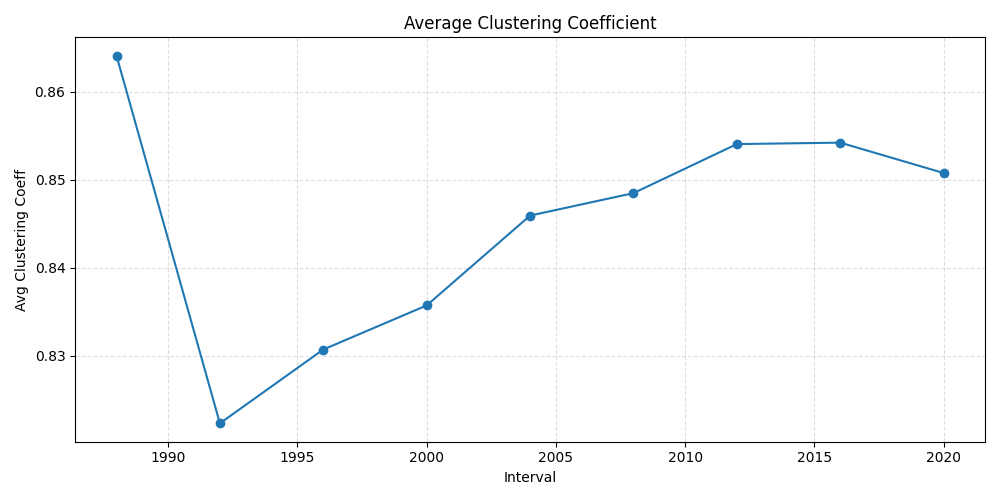
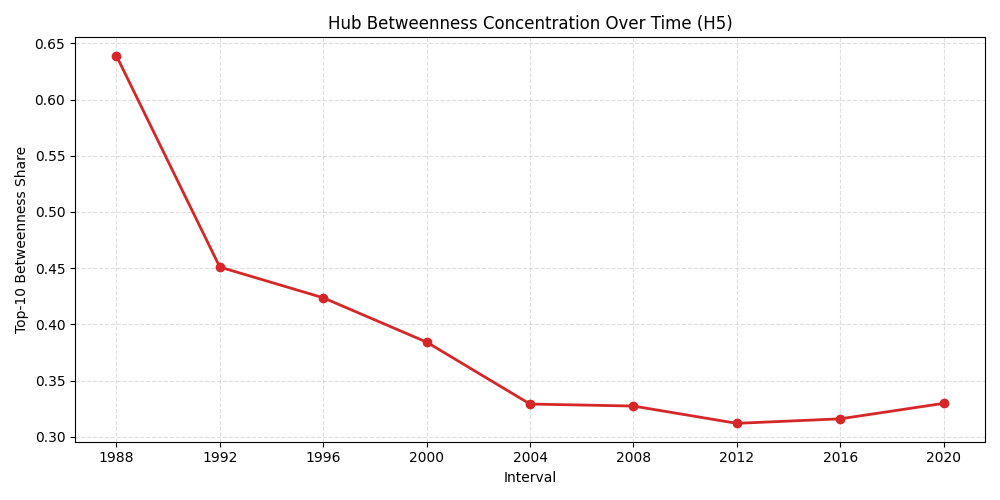
Reporting economies and their trade partners are nodes; trade relationships are weighted edges. A handful of hub economies carry a disproportionate share of connections, giving the network short average path lengths (any two countries are a few steps apart) alongside high local clustering - the small-world signature. That same hub structure is what makes it efficient but vulnerable to targeted disruption.
Path length falls 1.75 → 1.38 - the shrinking world.Clustering stays high (~0.85) across all intervals.Hub betweenness concentration, 1988-2022.1988-1991 - sparser, more centralized (vs. 2020-2022).
Key Insights
Persistent small-world structure (σ > 1.2 across all intervals) - high clustering, short paths
Resilient to random failure but vulnerable to targeted hub removal: ~15-20% hub removal fragments ~80% of the network
Strong regional clustering, with the Asia-Pacific bloc the most tightly knit
Geography and clustering strongly correlated (r = 0.72); cross-regional corridors carry global connectivity
Earthquake Pattern Analysis Using Clustering, Forecasting & Machine Learning: A Global Study (1960-2023)
Journal of Research in Environmental and Earth Sciences, Vol. 11(6) · Read Paper
A global study of seismic activity from 1960 to 2023 combining unsupervised clustering, an interactive density map, time-series exploration, and risk classification over 28,000+ earthquake records from the USGS catalog.
Raw USGS events are cleaned and featurized, then clustered two ways - K-Means (k=5, elbow-selected) to segment tectonic regions and DBSCAN to isolate dense zones from outliers. A SARIMA model explores magnitude trends and tree-based models explore risk classification. The more important finding came from the location-probability step, which flagged former nuclear-test sites in the catalog - a data-provenance issue documented rather than smoothed over.
Results
K-Means (k=5, elbow method) segmented events into five clusters aligning with major tectonic boundaries - Pacific Ring of Fire, Himalayan Belt, Mid-Atlantic Ridge, San Andreas system
DBSCAN (eps=0.5, min_samples=10) isolated dense seismic zones from outlier events
SARIMA and tree-based models were explored for magnitude trends and risk classification; because the risk target is derived largely from magnitude, classification results are reported as exploratory and their limitations documented
A Note on Data Provenance
Several highest-probability locations corresponded to former nuclear test sites (Nevada Test Site, Semipalatinsk) rather than natural seismicity - the catalog does not separate anthropogenic events. Flagged and documented; a filtered revision is planned.
Interactive: global seismicity, 1960-2023
Density and clustering of 28,000+ earthquakes worldwide - pan and zoom to find the hotspots.
Experience
AI Engineer Intern
Gogentic AIRemoteJun 2025 – Aug 2025
Built retrieval-augmented generation (RAG) pipelines in Python with FAISS vector indexing over NeuroVault neuroimaging data, enabling semantic search across unstructured scientific datasets.
Unified three enterprise data sources (Oracle, SQL Server, PostgreSQL) into a single retrieval layer and automated LLM-driven model workflows.
Developed AI meeting-summarization tooling with real-time voice-to-text transcription and privacy-aware analytics.
Business Intelligence Developer / Web Application Architect
Studium SpanIndiaJul 2023 – Jul 2024
Partnered with business stakeholders to define KPIs, then built and maintained Power BI and Tableau dashboards and scorecards used in daily operations (reported ~20% efficiency improvement).
Wrote SQL to extract, clean, and transform data from multiple source systems into reporting-ready datasets; designed the schema (SQL and MongoDB) and workflow for a real-time tracking application and led the delivery team.
Automated data-scrubbing and validation (reported ~15% data-accuracy improvement) and authored data-governance documentation.
Business Intelligence & Analytics Intern
Studium SpanIndiaJan 2023 – Jun 2023
Implemented data-integration solutions and predictive-analytics tooling using Python and SQL.
Built Power BI visualizations to drive business decisions and authored data-governance documentation.
Education
M.S., Data Science
University of Massachusetts, Dartmouth2024 – 2026 · thesis defended May 2026 · degree conferred Aug 2026